
Key Conclusions
After Hurricane Katrina, almost all New Orleans public schools were taken over by the state and eventually turned into autonomous charter schools. All educators were fired, and the union contract was allowed to expire. Almost all attendance zones were eliminated so that families, in principle, could choose any publicly funded school in the city. By the end of the state takeover 13 years later, all of the city’s schools were converted to charter schools. Now, New Orleans schools are reunified into one district governed by the local school board and superintendent. While this is consistent with school reform approaches in other cities, no city has gone as far as New Orleans. One of the missions of ERA-New Orleans is to understand these reforms.
This page offers an integrated live summary of all our findings to date. Having released 60 policy briefs and technical reports, we believe it is important to show how our findings fit together and what larger lessons they might provide for policymakers and practitioners. As with our policy briefs, the key conclusions below are based not only on our individual findings, but also on patterns across our studies and analyses by other researchers.
A much more extensive discussion and interpretation can be found in the book Charter School City, written by ERA-New Orleans director Douglas N. Harris.
Conclusion #1: Our findings reveal the New Orleans reforms led to large gains in average student achievement and increased rates of high school graduation, college entry, and college graduation in the first decade after they were implemented. Student outcomes have stabilized since then.
Conclusion #2: Equity in educational outcomes improved in some areas, but wide gaps by socioeconomic status and race/ethnicity remain. There were also unintended consequences for equity in terms of discipline practices and income-based segregation in schools.
Conclusion #3: A key factor driving improvement in average academic performance was the gradual process of closing and taking over low-performing schools.
Conclusion #4: A 13% increase in school spending likely contributed to student gains. However, these funds were used mainly to cover an increase in administrative spending. Instructional spending declined.
Conclusion #5: Transportation costs doubled, and students are traveling much farther to get to school.
Conclusion #6: The reforms significantly changed the teacher workforce and the way teachers view their work.
Conclusion #7: Student surveys suggest that the quality of teaching is somewhat below the national urban district average, especially in classroom management and caring.
Conclusion #8: The reforms had some unintended consequences, including a reduced focus on the arts and decreased access to early childhood education.
Conclusion #9: We do not find evidence of other potential unintended consequences, including student mobility and crime rates.
Conclusion #10: The state’s school voucher program, the Louisiana Scholarship Program (LSP), a related type of school reform, had negative effects on participating students’ math and English scores.
Conclusion #11: New Orleans faced a unique set of circumstances after Hurricane Katrina. Whether other cities can expect similar academic benefits from New Orleans-style reforms is uncertain.
Conclusion #12: Further improvements are being hindered by ongoing distrust among key stakeholders and the lingering effects of COVID.
Conclusion #1: Our findings reveal the New Orleans reforms led to large gains in average student achievement and increased rates of high school graduation, college entry, and college graduation in the first decade after they were implemented. Student outcomes have stabilized since then.
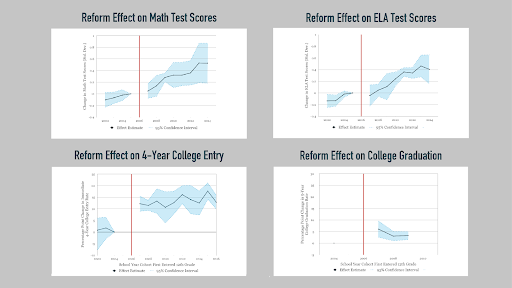
We find that test scores rose by 11-16 percentiles, depending on the subject and analysis method (Figure 1). Other important indicators rose as well: the high school graduation rate increased by 3-9 percentage points, college entry rates grew by 8-15 percentage points (a trend that continues in more recent years of data), and college graduation rates grew 3-5 percentage points. The quality of colleges that students attended and some measures of college persistence also increased, while others were unchanged.
Figure 1: Student test scores increased for all tested subjects in New Orleans, as well as college entry and graduation rates.
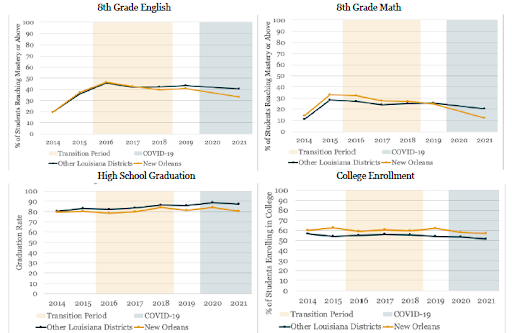
Early on, critics considered several other potential explanations for these gains, such as changing demographics. However, we have tested these alternative explanations and find that the reforms caused the vast majority of the improved outcomes. (School funding is an additional possible explanation. See Conclusion #4.) Most student outcomes peaked around 2013 and have since plateaued. During and immediately after the transition back to local control, student test scores in 3rd and 8th grades and in high school graduation rates remained similar to those in districts across Louisiana (Figure 2). College enrollment rates during the same period remain above those in other Louisiana districts. However, with only one school year post-reunification before the COVID-19 pandemic hit, it is difficult to draw strong conclusions about the impact of reunification on students.
Figure 2: Student outcomes in New Orleans schools during and immediately after reunification were similar to those in districts across the state.
Conclusion #2: Equity in educational outcomes improved in some areas, but wide gaps by socioeconomic status and race/ethnicity remain. There were also unintended consequences involving equity in terms of discipline practices and income-based segregation in schools.
The reforms helped reduce educational opportunity gaps for Black and low-income students, at least in terms of high school graduation rates and college outcomes. Results are more mixed in terms of test scores. Some results show that opportunity gaps worsened, and others suggest no change in recent years. We also see reduced test score gaps between students with disabilities and other students.
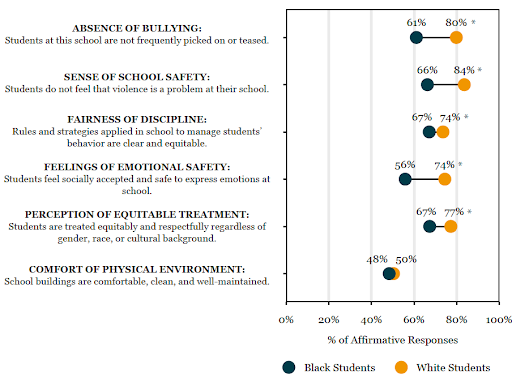
However, our survey of New Orleans youth in the 2018-19 school year found that Black students consistently report less positive educational environments than White students (Figure 3). That survey also found smaller but significant racial gaps on questions related to teaching quality.
Figure 3: Black students in New Orleans perceive poorer school climates than White students.
Our second survey of New Orleans youth in the 2021-22 school year found similar disparities. Unlike most of our other work, we do not have survey data from before Katrina and therefore cannot determine whether these disparities are related to the reforms. There were additional troubling signs of inequity: schools apparently selected students rather than students choosing schools. The expulsion rates increased 1.5-2.7 percentage points (140-250%) in the early years. This finding has implications for racial equity, since across the state of Louisiana, Black students were twice as likely as White students to be suspended.
Over time, several of these unintended consequences were alleviated as the city re-centralized certain aspects of the school system, including implementing a citywide expulsion system and a common enrollment system called the OneApp/NCAP (NOLA-PS Common Application Process). Suspension and expulsion rates have returned to near pre-Katrina levels. Some schools have significantly reduced suspensions through the use of alternative behavioral management systems such as Positive Behavior Intervention Systems And restorative practices.
Finally, there were fears that charter schools would increase segregation. At the high school level, we find evidence for increased segregation by race and income, but not by special education status. We find no strong evidence of increased segregation at the elementary school level. In one respect, equitable access has worsened. A policy change instituted in 2019 prioritizes admission at most elementary schools for applicants who live within a half-mile of the school. We find that this gives White and high-income students an advantage in securing a seat at high-demand schools.
Conclusion #3: A key factor driving improvement in average academic performance was the gradual process of closing and taking over low-performing schools.
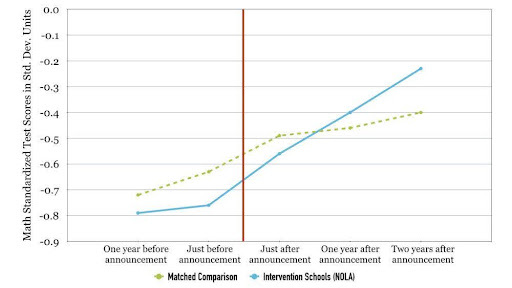
Under the reforms, non-profit management organizations are hired to operate schools via performance-based contracts. If schools do not meet their benchmarks, then they are closed and turned over to other non-profit management organizations. This process has driven essentially all of the post-Katrina improvement. This was especially true in the first decade after Katrina; low-performing schools were replaced by higher-performing ones, which gradually lifted average student achievement. There are multiple ways in which school closure and takeover can play a role, including replacing low-performing school operators with higher performers and creating pressure on schools to improve. On the other hand, it could be that students attending schools that are closed or taken over experience negative effects. We find that this is not the case (see Figure 4) if school governing bodies close or takeover the lowest performing schools. Current district policy provides priority and support to students in closed schools so that they end up in better schools the following school year.
Figure 4: Students in schools that were closed or taken over experienced significant improvements in student achievement.
Given the focus on performance-based contracts, the choice of performance metrics is critically important. School performance contracts reflect state accountability systems and generally reward schools based on students’ average test scores. However, since students come to school with different initial achievement levels, this tends to unfairly punish schools serving the most disadvantaged students. In contrast, “value-added” measures account for how much students grow from the beginning of the year. Our research finds that if government agencies gave value-added measures equal weight to average test scores in their school performance ratings, then 24.2% of elementary schools and 32.9% of high schools in Louisiana would change performance categories (e.g., moving from a letter grade of F to D). Since changing letter grades would also affect which schools are shut down for low performance, we estimate this change in measurement alone would increase annual student test scores for the bottom fifth of all schools statewide by about 0.4 percentiles and increase the statewide high school graduation rate by 0.4 percentage points. (In Conclusion #7, we also discuss some unintended consequences of performance-based contracts.)
Conclusion #4: A 13% increase in school spending may have likely contributed to student gains. However, these funds were used mainly to cover an increase in administrative spending. Instructional spending declined.
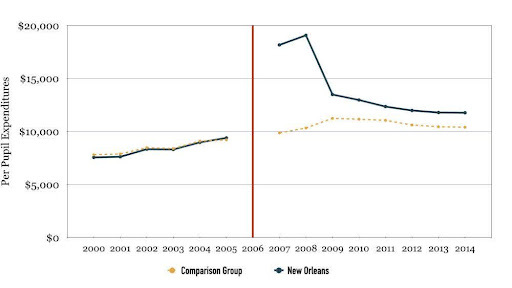
School spending increased relative to comparison districts because of changes in both government funding and increased philanthropic dollars (Figure 5). This remained true even after the initial spike in spending, which was apparently due to the slow return of students combined with the start-up costs for the new system.
Figure 5: The reforms increased operating spending.
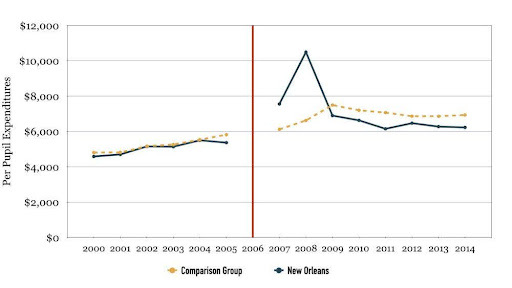
Increased spending probably explains some portion of the reform effects, but debate remains about how much it contributed to students’ improved academic outcomes. Our research suggests that the increased revenues were partly driven by the reforms themselves, as public support for spending increased. Also, pre-Katrina schools were generally ineffective in converting school resources into school improvement, so increasing school spending alone very likely would not have generated the outcomes described above, without the reforms. We have also studied how publicly funded schools in New Orleans spent these additional funds. Instructional spending decreased by 10% ($706 per student) relative to the comparison group (Figure 6). This reduction was partly driven by reduced teacher experience, as well as the fact that charter schools are not required to participate in the state pension system.
Figure 6: The reforms reduced instructional spending.
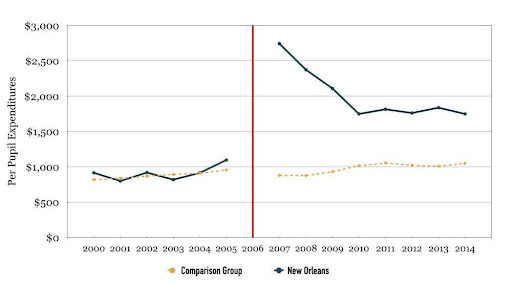
As shown in Figure 7, there was also higher spending on administration (66% or $699 per student), which could be explained by the loss of economies of scale in this decentralized system. The educational models of charter schools could also involve higher management costs and perhaps a more top-heavy approach; schools hired more managers and paid them higher salaries.
Figure 7: The reforms increased administrative spending.
A more recent report shows that these changes in salaries persisted through 2018-2020. While teachers’ salaries were on average 8% lower in 2018-2020 compared with pre-Katrina, administrators' salaries were on average 22% higher. The student-teacher ratio was similar in 2018-2020 compared with pre-Katrina, but there were more administrators, aides and counselors per student. We compared these changes to those in neighboring Jefferson Parish and found much larger changes among New Orleans schools.
Conclusion #5: Transportation costs also doubled, and students are traveling farther to get to school.
School choice is designed to allow families to select any school that matches their children’s needs. However, choices are limited in practice as preferred schools may be far away and students are not guaranteed admittance to the schools closest to home. This limitation particularly affects low-income families that may have less access to personal transportation. Car access fundamentally shapes families’ school requests and placements. Our research suggests that since Katrina, the average distance to school has increased by at least two miles. Also, from a sample of school bus stops, we find that the average time from each bus stop to school is 35 minutes (each way), and 25% of bus trips take 50 minutes or more to get to school. Students in New Orleans East, the West Bank, and Uptown have longer commutes than the average. Students must leave earlier (usually before 7 a.m.) and get home later. Partly as a result of these longer distances, transportation costs have nearly doubled to upwards of $750 per student per year. Another possible cause of rising transportation costs is decentralization of school management, which makes it difficult for schools and management organizations to leverage economies of scale.
Conclusion #6: The city’s reforms significantly changed the teacher workforce and the way teachers viewed their work.
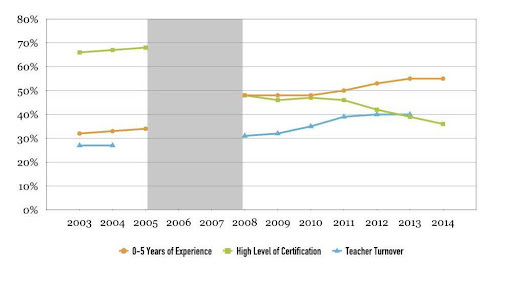
Given that all teachers were fired and that schools gained considerable control over personnel, it is no surprise to see changes among the city’s teachers. Many of the changes appear to go against what are considered the hallmarks of school quality. Teacher turnover increased, as did the share of teachers with low levels of experience (Figure 8). Meanwhile, the share of teachers with advanced credentials decreased.
Figure 8: Teacher credentials declined after the reforms while teacher turnover and the share of teachers with low levels of experience increased.
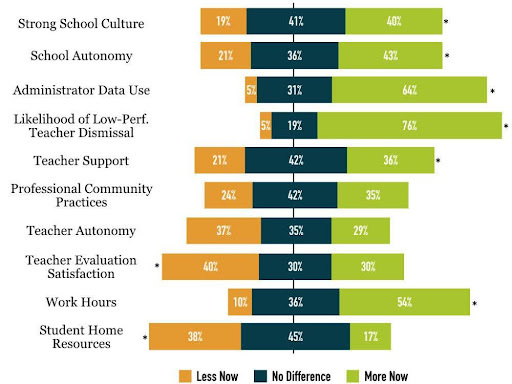
In addition, the share of the teaching workforce that is Black decreased from 71% in 2005 to 49% in 2014 and there have been only small improvements since then. In 2020, school administrators and teachers who are Black on average receive lower compensation than their White counterparts. There is also some evidence that the number of students graduating from local universities with teacher credentials declined sharply. The increased turnover is partly driven by the fact that many newly hired teachers came from teacher preparation and placement programs whose completers are less likely to stay in the profession. Lower job security also likely increased turnover, both by making the jobs less attractive and increasing dismissals. Consistent with this theory, in a statewide analysis, we found that the removal of tenure led to increased teacher departures from public school teaching. The fact that schools have much more control over personnel under the reforms means that teacher evaluation could potentially have a big impact on continued employment, salaries, promotion and more. However, the way that New Orleans schools responded to state-mandated teacher evaluation systems varied greatly. While some schools took evaluations seriously and used them to be more reflective about their teaching, others admitted in interviews to trying to “game the system” through tactics like sending certain students out of the room when observers came by. There is some evidence that school choice reforms have made it easier to remove lower quality teachers, as advocates said they would. Lower performing teachers in New Orleans are 2.5 times more likely to leave their school than high-performing teachers, compared with only 1.9 times in traditional public schools located in neighboring districts. However, average teacher performance has not increased relative to neighboring districts. Again, high turnover creates a larger share of new, lower quality teachers in New Orleans. While the reforms increased the probability that low-performing teachers exited schools, school closures also led to a significant increase in the likelihood of a teacher leaving the profession, thus increasing turnover and instability in the teacher labor market. A decline in teacher autonomy and increased work hours likely contributed to this near-doubling of teacher turnover. As found in districts across the country, New Orleans teachers are more likely to switch schools if they are new, in lower-achieving schools, in schools in lower-income neighborhoods, or facing changes in leadership. Our 2014 survey of teachers who returned after Katrina (Figure 8) found that they were less satisfied with their jobs due to reduced job security, decreased teacher autonomy, and longer work hours. Heavy workloads and teacher burnout were cited as major complaints by teachers who attempted unionization campaigns in their charter schools. Returning teachers also reported that schools are much more data-driven and goal-oriented, especially with respect to academic goals, and school culture, and support for teachers.
Figure 9: Teachers' views on how learning and work environments changed after the reforms.
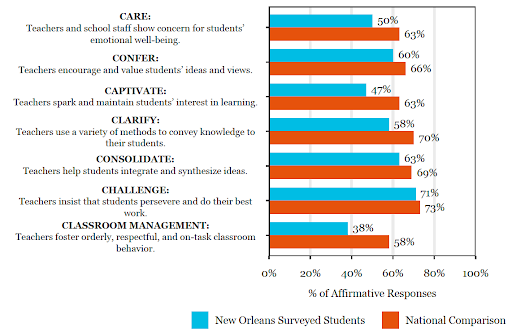
Conclusion #7: Student surveys suggest that the quality of teaching is somewhat below the national urban district average, especially in classroom management and caring.
Our 2018-19 survey of New Orleans youth found that students perceive lower teaching quality in New Orleans schools than students in similar schools nationally. In particular, 63% of students nationally report that their teachers care about them, compared with only 50% of New Orleans students (Figure 10).
We asked students to report on these same measures three years later and found some improvements in student perceptions of their teachers’ classroom management, encouragement of ideas and views, and ability to help students clarify and consolidate information. However, there were no improvements in reports of teacher caring. There is some evidence that nationally, districts experienced similar improvements, suggesting that New Orleans students still rate their teachers worse compared to students in districts across the country.
Figure 10: New Orleans students rated their teachers lower than students in a national comparison group did on every dimension of teacher quality.
We do not have similar measures of student perceptions of teaching quality from before the reforms, so we cannot draw conclusions about whether students’ perceptions of their teachers prior to Katrina were different from those reported in more recent years. However, we do view these results as evidence that New Orleans teachers could be doing a better job of supporting students in the classroom.
Conclusion #8: The reforms had some unintended consequences, including a reduced focus on the arts and decreased access to early childhood education.
Earlier, we discussed some unintended consequences for equity, school spending, and more. Below, we discuss additional negative consequences not yet introduced. The introduction of charter schools reduced the availability of early childhood program offerings after the reforms. Charter operators are not required to offer pre-K, and because state subsidies do not cover the full cost of educating pre-K students, schools must make up the funding gap within their own budget. Since early childhood programs became a part of the centralized enrollment system in New Orleans, there have been improvements in the support and information parents have access to, which has increased overall enrollment in these programs.
We also find that schools in New Orleans focus less on the arts. Arts educators have reported feeling ignored and under-resourced compared to educators in tested subjects. Fewer K-8 students in New Orleans enroll in arts enrichment courses than in similar districts across the state.
Conclusion #9: We do not find evidence of other potential unintended consequences, including student mobility and crime rates.
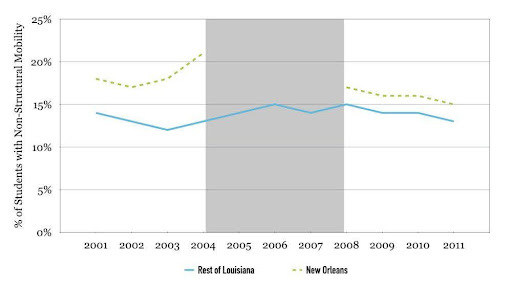
Other feared unintended consequences of the school reforms did not emerge. One concern has been that school choice would increase student mobility as families shopped around for the best schools, creating disruption for students and for their classmates. However, student mobility dropped (Figure 11).
Figure 11: The post-Katrina school reforms reduced student mobility.
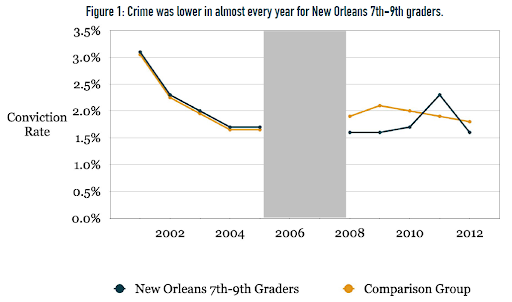
Another potential concern, especially with the aggressive closure and takeover of schools based almost entirely on raising student test scores, is that schools might all look alike. However, New Orleans schools have maintained or increased diverse program offerings. With an increase in exclusionary discipline practices in the early years of the reforms, there was a fear that more New Orleans youth would enter the school-to-prison pipeline. Our evidence does not support this, however. Rather, we find some evidence that the reforms reduced conviction rates among New Orleans youth, compared with similar students across Louisiana (Figure 12).
Figure 12: Convictions were lower in almost every year for New Orleans 7th-9th graders.
Conclusion #10: The state’s school voucher program, the Louisiana Scholarship Program (LSP), a related type of school reform, had negative impacts on participating students’ math and English scores.
While our work is primarily focused on New Orleans charter schools, school vouchers are another form of choice-based reforms. With vouchers, families can use public funds to send their children to private schools (including religious schools). Our findings about LSP vouchers are as follows:
-
The LSP showed negative effects on student outcomes after three years. The program seemed to get off to a very rough start with very large negative effects, before rebounding somewhat, then dipping again. The reasons for the initial “dip and return,” and the absence of positive effects three years later, have been a subject of active debate.
-
Our voucher research also suggests that many private schools in Louisiana did not participate in the program because they did not want to accept current or future burdensome regulation. This would be a problem especially if the rules keep out high-quality private schools.
-
While participating voucher schools did not apparently differ on the main direct measure of quality, participating schools did tend to have lower-than-average tuition and enrollment levels. If quality had been lower, this would be a potential reason the voucher program had a negative effect.
-
Our other voucher studies suggest that vouchers had no effect on racial segregation and decreased the percentage of students who were identified for special education.
Conclusion #11: New Orleans faced a unique set of circumstances after Hurricane Katrina. Whether other cities can expect similar academic benefits from New Orleans-style reforms is uncertain.
The post-Katrina reforms generated impressive results in terms of outcomes like test scores, high school graduation rates, and college entry rates. However, that does not mean that other cities will get the same results simply by copying the New Orleans model. New Orleans is distinctive in ways that made these reforms especially effective here:
-
More Money. While more money by itself would very likely not have produced the effects reported above, the additional funding likely did amplify the reform effects. States and cities seeking to save money or increase student achievement without additional resources may be disappointed.
-
Ample Educator Workforce. In New Orleans, the supply of educators expanded in ways that other cities will generally not be able to replicate. It was an attractive city for young people even before the reforms. Many apparently also wanted to come to New Orleans to help rebuild the city, while others, especially school leaders, may have come because the city became a national hub of school reform.
-
Low Starting Point. New Orleans was one of the lowest-performing school districts in Louisiana, and the country, in the pre-Katrina period. A low starting point gave the city more potential to improve.
We cannot measure everything—and not all decisions about education and school reform can be answered with data. But with this research, we can answer some of the important questions on the minds of community members in New Orleans and across the country who seek to provide a high-quality education to children across the nation.
Conclusion #12: Further improvements are being hindered by ongoing distrust among key stakeholders, and the lingering effects of COVID.
State control of New Orleans schools ended in 2018, but the local district did not regain many of the powers that it held pre-Katrina, including school staffing and curriculum and instruction. Rather, the reunification largely meant reinforcing the governance and management that had been in place under the state takeover, but at the local level.
There remains strained relationships and confusion about roles among the district, school leaders, and the community. This is rooted in two main factors: first, the fact that the reforms were initiated by state takeover in the aftermath of Hurricane Katrina without broad public input; and, second, the new and different role played by the elected school board. The community expects action when complaints are made, but the district no longer manages day-to-day operations of schools. Likewise, many schools want the district to provide more support–not just accountability–but this is arguably outside of the district’s capabilities. These issues will need to be addressed to support continued improvements in the school district.
Although student outcomes remained consistent during and immediately after reunification (see Conclusion #1), there have been some declines in student test scores and graduation rates associated with COVID-19. New Orleans faced greater health risks than many areas in the country and students spent more time learning remotely. The city is still grappling with these learning losses.